
Morgan Stanley : We’ve received significant pushback on our assumption that DKNG can achieve 23% margins by 2025. We do a deep dive comparing DKNG to int’l comps to outline what drives our assumptions and gives us confidence in our forecasts and OW rating.
We forecast DKNG achieving 23% margins in 2025, positive but 300-1,300bps below mature comps. The biggest pushback we have gotten from our recent DKNG upgrade has been our assumption the company can achieve 23% margins in 2025. Admittedly, the state-by-state rollout of online sports betting and iGaming makes confidence in a single year difficult (we outlined how CA could be a ~$300m headwind to 2023 profits if legalized); however, we see 23% margins as achievable at maturity. 23% is well below (OW-rated) FLTR’s UK & Ireland (36%), Australia (34%), and Int’l (26%) online segment margins, (OW-rated) Entain’s 31%, and Kindred’s 26% (not covered). 1 and inside show the key expense line differences that should drive margins higher/lower, and where we may be aggressive/conservative. One key point to highlight, though, is that mature markets have proven that scale typically has a positive correlation to margins (4), which should benefit DKNG.
Expect DKNG’s cost of sales % to be higher than most comps, ex FLTR’s Sportsbet (Australia). 2 breaks down the key differences in expenses for our DKNG’s 2025 margin forecasts compared to FLTR’s 1H21 ex-US performance, ENT’s 1H21, and Kindred’s 2021 results. We estimate DKNG’s cost of sales will be 46% of NGR, above FLTR’s Int’l and UK & Ireland (29%/30%), ENT’s 38%, and Kindred’s (40%), and comparable only to FLTR Australia (47%). We expect DKNG to have a higher cost of sales % given the US’s relatively high tax rate, higher payment & processing fees, and market access fees. However, we model gaming taxes at 25% of GGR long term (30% of NGR) vs. 20% in 2021, which could prove to be conservative. While NY’s recent 51% tax rate highlights risk, the other 10 states that legalized sports betting last year had tax rates of 20% or under. In addition, more states are legalizing OSB without giving market access to the casinos, and DKNG’s scale should give it negotiating leverage for new agreements / renewals. Finally we model payment processing at 7% of NGR which if more banks accept transactions, could scale lower.
Forecast DKNG’s marketing spend at 20% of 2025 NGR, at the higher end of comps. We forecast DKNG’s marketing spend will be 20% in 2025, elevated relative to FLTR Australia (10%) and comparable with FLTR UK & Ireland, ENT and Kindred (19% each) while being lower than FLTR’s Int’l business (25%).This is largely due to the attractiveness and relative immaturity of the US mkt, and hence competitive spending. However, we expect the US market to be heavily concentrated, with the top 5 operators controlling >85% mkt share, with FLTR’s most concentrated market internationally (Australia) having the lowest marketing % at 10%. We also believe that DKNG has a customer acquisition advantage relative to int’l peers through its legacy daily fantasy sports database. TSG (acquired by Flutter in 2020) had a similar customer acquisition advantage through its PokerStars database and spent 17% on marketing in 2018 vs. the 7th most efficient player in the space at 29% (9), though it also had a poker liquidity advantage to leverage.
One risk highlighted around marketing was that DKNG and peer US sports betting companies have committed to considerable fixed marketing agreements with leagues/celebrities/teams, which may make rationalizing spending harder. We estimate DKNG to have ~$1.35B in annual marketing spend in 2022-24, dropping to $950m in 2025 once fewer new states are in their initial ramp phases. However, adding in promotions, we model DKNG will still spend ~37% of gross revenue on promotions. In addition, 8 highlights how scale can lead to considerably greater marketing efficiency, with Sportsbet’s outsized revenue position enabling marketing spend of just 12% of NGR vs. a sliding scale of 16-31% for its peers depending on size. As DKNG has highlighted repeatedly, scale will allow it to more efficiently nationally advertise.
We forecast DKNG will spend 11% of NGR on Other Opex in 2025, towards the lower-end of FLTR’s 9-19% 1H21 range and below Entain’s 12% and Kindred’s 15%. On an absolute basis, this still implies ~$500m of opex spending on product, technology, and G&A, or ~2x Kindred, in line with Entain, and around half of Flutter. DKNG will only really be operating in one geography, which could be an advantage as it won’t need multiple HQs in each region and support staff for different languages, or a detriment as it can’t scale as easily. It implies DKNG grows Other Opex at a 9% CAGR in 2021-25.
Promotional spending will be a big determinant of margins. The biggest driver of DKNG’s EBITDA margin inflection by 2025, in our view, is dissipating promotional/marketing spending. We estimate promo spend (which is a contra-revenue) at 40% of GGR in 2021 and declining to 22% in 2025. DKNG has shown this in PA already, with its promo spending dropping from 48% in 2019 to 39% in 2020 to 27% in 2021. This, in turn, means that cost of revenues as a % of NGR can decline 800bps despite higher taxes, meaning that as % of GGR it in fact widens 200bps. While market participants have suggested that promos as a % of GGR decline over time, FLTR’s Sportsbet has seen its promo % increase from 12% in 2016 to 26% in 2020. However, this is a function of Sportsbet spending to maintain / drive its highly concentrated (~50%) market share, while spending less on marketing. We model DKNG spending 37% of GGR on promos + marketing in 2025, vs. Sportsbet ~36%.
Sportsbet proves that margins can be high in single product geographies. Despite Australia having only online sports betting and not iGaming, similar to what we expect in most US states, FLTR’s Sportsbet has 34% margins. While investors push back that Australia has lower taxes, that doesn’t tell the whole story. While Australian gaming taxes are indeed lower than the US at 10.5% of NGR/15% of GGR vs. our forecast for DKNG of 25%/30%, Sportsbet also pays a 9% goods & services tax (GST). In addition, Sportsbet has to pay mandatory fees to racing entities and sports leagues. In its entirety, Sportsbet spends 43% on taxes/fees (5), which results in gross profit margins of 53% vs. our 2025 DKNG forecast of 54%. Investors also highlight that Sportsbet’s strong margins are driven by its high market share, but if we assume Sportsbet’s marketing spend was 20% of revenue instead of its 10%, it would imply EBITDA margins of 24%, in line with our 23% DKNG forecast.
Prior reports: DraftKings Inc: Too Big an Opportunity to Ignore; Upgrade to Overweight (26 Jan 2022), DraftKings Inc: Addressing Feedback on Our Upgrade (31 Jan 2022).
Online sports betting sites score as NFL season gets under way
BOSTON (Reuters) - Top online sports betting servi...
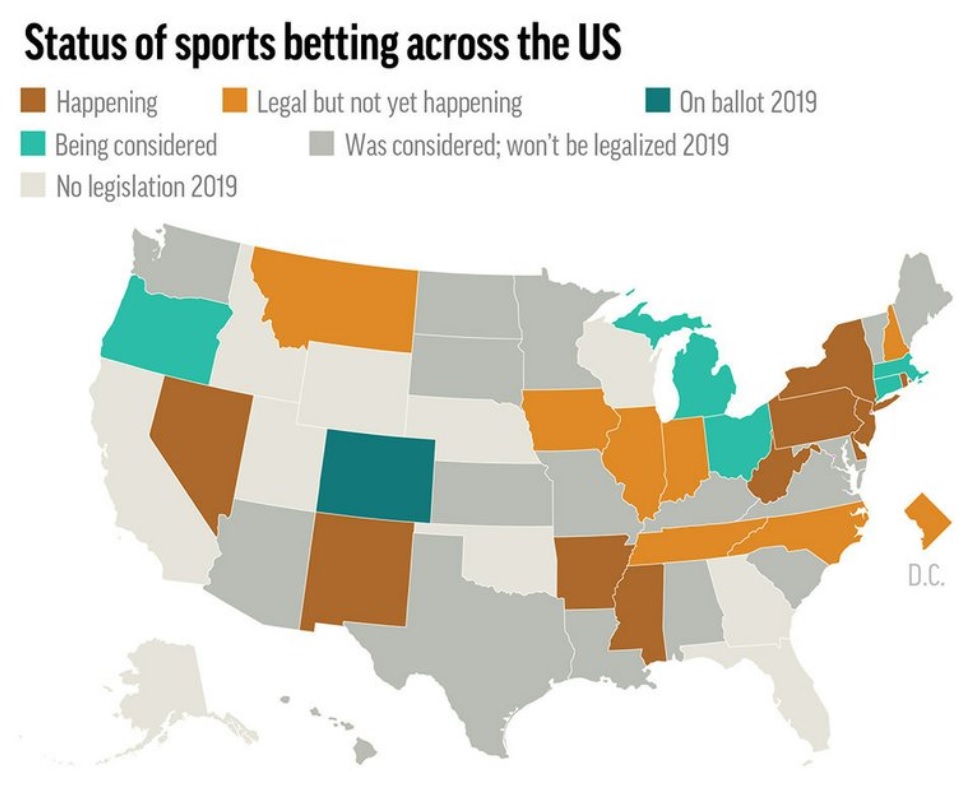
Sports betting is days away from becoming legal in Indiana
INDIANAPOLIS (AP) — Sports betting is days away fr...

NFL Brings On-board Sportradar
Compared with other U.S. sports leagues, the NFL h...
BtoBet's Euro 2020 Report On Opportunities For Operators
The company addresses areas that include infrastru...

American Gaming Association Releases New Responsible Marketing Code for Sports Betting
Today, we’re proud to release the industry’s first...


