HARRISBURG, PA: The Pennsylvania Gaming Control Board reported today that the combined total revenue generated from all forms of gaming along with fantasy contests during June 2022 was $389,828,232 an increase of 0.24% compared to revenue generated in June 2021.
Sources of gaming revenue regulated by the Pennsylvania Gaming Control Board include slot machines, table games, internet gaming, sports wagering, fantasy contests and video gaming terminals (VGTs). The Board has posted separate reports for these types of gaming on its website, https://gamingcontrolboard.pa.gov/ .
The following chart compiles all revenue generated in June 2022 by casinos along with fantasy contests and video gaming terminals operated by other vendors and includes a comparison to total revenue generated last June.
| Source | June 2022
Total Revenue |
June 2021
Total Revenue |
% Change |
| Hollywood Casino at Penn National | $56,964,964 | $53,788,026 | 5.91% |
| Parx Casino | $52,358,544 | $58,428,426 | -10.39% |
| Rivers Casino Philadelphia | $42,679,355 | $43,646,374 | -2.22% |
| Wind Creek Bethlehem | $42,006,612 | $36,372,891 | 15.49% |
| Valley Forge Casino Resort | $34,549,024 | $42,317,789 | -18.36% |
| Rivers Casino Pittsburgh | $29,012,277 | $28,429,575 | 2.05% |
| Live! Casino Philadelphia | $22,327,526 | $20,580,890 | 8.49% |
| Mohegan Sun Pocono | $20,535,654 | $18,911,961 | 8.59% |
| Mount Airy Casino Resort | $19,485,605 | $21,985,651 | -11.37% |
| Harrah’s Philadelphia | $17,322,841 | $17,288,954 | 0.20% |
| Hollywood Casino at the Meadows | $17,005,600 | $20,203,983 | -15.83% |
| Presque Isle Downs and Casino | $8,972,739 | $10,036,957 | -10.60% |
| Live! Casino Pittsburgh | $8,168,198 | $8,366,366 | -2.37% |
| Hollywood Casino York | $6,827,320 | n/a | n/a |
| Hollywood Morgantown | $4,875,080 | $1,325,326 | 267.84% |
| Video Gaming Terminals | $3,506,902 | $3,303,745 | 6.15% |
| Lady Luck Casino Nemacolin | $1,724,027 | $2,014,215 | -14.41% |
| Fantasy Contests | $1,505,963 | $1,891,667 | -20.39% |
| Statewide Total | $389,828,232 | $388,892,795 | 0.24% |
Total tax revenue generated collectively through all forms of gaming and fantasy contests was $161,165,506 during June 2022.
June Revenue by Game Type
The Board is also providing a synopsis of revenue year-over-year by types of games:
| Type of Gaming Revenue | June 2022 | June 2021 | % Change |
| Retail Slots Revenue | $192,999,137 | $182,971,087 | 5.48% |
| Retail Tables Revenue | $76,122,937 | $77,586,113 | -1.89% |
| iGaming Slot Revenue | $72,279,464 | $60,451,078 | 19.57% |
| Sports Wagering Revenue | $12,769,552 | $34,225,520 | -62.69% |
| iGaming Tables Revenue | $28,043,900 | $26,045,907 | 7.67% |
| Video Gaming Terminals Revenue | $3,506,902 | $3,303,745 | 6.15% |
| iGaming Poker Revenue | $2,600,377 | $2,417,679 | 7.56% |
| Fantasy Contests Revenue | $1,505,963 | $1,891,667 | -20.39% |
| Total Gaming Revenue | $389,828,232 | $388,892,795 | 0.24% |
Retail Slot Machine Revenue
June’s gross revenue from slot machines was $192,999,137, a 5.48% increase in revenue when compared to the $182,971,087 generated in June 2021.
The number of slot machines in operation in June 2022 was 25,823 compared to 26,156 at the casinos in June 2021.
Slot machine revenue for each of the casinos, with the percentage change reflected over the previous year, is as follows.
| Casino | June 2022 Slots Revenue | June 2021 Slots Revenue | % Change |
| Parx Casino | $31,717,968 | $34,828,737 | -8.93% |
| Wind Creek Bethlehem | $22,513,368 | $21,167,652 | 6.36% |
| Rivers Pittsburgh | $21,146,033 | $19,503,111 | 8.42% |
| Mohegan Sun Pocono | $15,157,422 | $14,034,551 | 8.00% |
| Hollywood Casino at the Meadows | $13,661,898 | $12,193,858 | 12.04% |
| Hollywood Casino at Penn National | $12,197,690 | $13,738,265 | -11.21% |
| Mount Airy Casino Resort | $11,749,549 | $12,310,915 | -4.56% |
| Harrah’s Philadelphia | $11,092,336 | $11,435,232 | -3.00% |
| Live! Casino Philadelphia | $10,515,779 | $9,948,401 | 5.70% |
| Rivers Philadelphia | $9,991,062 | $10,191,101 | -1.96% |
| Valley Forge Casino Resort | $8,102,920 | $7,090,163 | 14.28% |
| Presque Isle Downs and Casino | $7,793,599 | $7,948,109 | -1.94% |
| Live! Casino Pittsburgh | $7,055,187 | $6,742,704 | 4.63% |
| Hollywood Casino York | $5,121,429 | n/a | n/a |
| Hollywood Casino Morgantown | $3,612,904 | n/a | n/a |
| Lady Luck Casino Nemacolin | $1,569,992 | $1,838,288 | -14.59% |
| Statewide Total | $192,999,137 | $182,971,087 | 5.48% |
Tax revenue from the play of slots machines in June 2022 was $98,343,418*.
Retail Table Games Revenue
Table games revenue for June 2022 was $76,122,937, a decrease of 1.89% from June 2021 when revenue was $77,586,113.
Table games revenue for each of the casinos, with the percentage change reflected over the previous year, is as follows.
| Casino | June 2022 Table Games Revenue | June 2021 Table Games Revenue | % Change |
| Wind Creek Bethlehem | $18,224,923 | $13,946,578 | 30.68% |
| Parx Casino | $16,492,627 | $17,898,360 | -7.85% |
| Live! Casino Philadelphia | $8,658,786 | $9,239,781 | -6.29% |
| Rivers Pittsburgh | $6,917,091 | $7,434,388 | -6.96% |
| Rivers Philadelphia | $6,506,927 | $8,266,641 | -21.29% |
| Mount Airy Casino Resort | $3,229,950 | $3,122,119 | 3.45% |
| Mohegan Sun Pocono | $3,026,088 | $2,325,468 | 30.13% |
| Harrah’s Philadelphia | $2,921,088 | $4,020,463 | -27.34% |
| Valley Forge Casino Resort | $2,635,702 | $3,435,267 | -23.28% |
| Hollywood Casino at Penn National | $1,595,185 | $2,693,789 | -40.78% |
| Hollywood Casino York | $1,457,793 | n/a | n/a |
| Hollywood Casino at the Meadows | $1,404,671 | $2,167,934 | -35.21% |
| Live! Casino Pittsburgh | $1,049,270 | $1,486,082 | -29.39% |
| Presque Isle Downs and Casino | $987,999 | $1,373,314 | -28.06% |
| Hollywood Casino Morgantown | $860,803 | n/a | n/a |
| Lady Luck Casino Nemacolin | $154,035 | $175,928 | -12.44% |
| Statewide Total | $76,122,937 | $77,586,113 | -1.89% |
Total tax revenue from table games play during June 2022 was $12,264,474*.
Internet Casino-Type Gaming (iGaming) Revenue
Casino games offered online generated gross revenue of $102,923,741 during June 2022 compared to $88,914,664 in June 2021 an increase of 15.76%.
A breakdown of revenue of casino games offered online is as follows:
| Casino Operator | Total Internet Games
Revenue |
Internet
Slots Revenue |
Internet
Table Games Revenue |
Internet
Poker Revenue |
| Hollywood Casino at Penn National | $42,030,103 | $28,039,259 | $13,764,170 | $226,674 |
| Rivers Casino Philadelphia | $25,483,540 | $22,301,812 | $3,119,219 | $62,509 |
| Valley Forge Casino Resort | $18,401,152 | $10,518,708 | $7,882,445 | |
| Mount Airy Casino Resort | $4,183,131 | $1,742,121 | $821,833 | $1,619,177 |
| Harrah’s Philadelphia | $3,266,166 | $1,783,428 | $790,722 | $692,016 |
| Parx Casino | $2,919,888 | $2,302,671 | $617,216 | |
| Live! Casino Philadelphia | $2,878,477 | $2,491,569 | $386,909 | |
| Mohegan Sun Pocono | $2,244,729 | $1,830,701 | $414,029 | |
| Wind Creek Bethlehem | $1,232,935 | $1,139,792 | $93,143 | |
| Presque Isle Downs and Casino | $283,619 | $129,404 | $154,215 | |
| Statewide Total | $102,923,741 | $72,279,464 | $28,043,900 | $2,600,377 |
Tax revenue generated from internet gaming play during June 2022 was $43,911,092*.
Total iGaming revenue for each of the casinos during June 2022 and June 2021, if applicable, is as follows:
| Casino Operator | June 2022 iGaming Revenue | June 2021 iGaming Revenue | % Change |
| Hollywood Casino at Penn National | $42,030,103 | $34,870,112 | 20.53% |
| Rivers Casino Philadelphia | $25,483,540 | $23,336,153 | 9.20% |
| Valley Forge Casino Resort | $18,401,152 | $14,953,787 | 23.05% |
| Mount Airy Casino Resort | $4,183,131 | $5,854,117 | -28.54% |
| Harrah’s Philadelphia | $3,266,166 | $1,718,884 | 90.02% |
| Parx Casino | $2,919,888 | $3,568,334 | -18.17% |
| Live! Casino Philadelphia | $2,878,477 | $749,056 | 284.28% |
| Mohegan Sun Pocono | $2,244,729 | $2,122,641 | 5.75% |
| Wind Creek Bethlehem | $1,232,935 | $1,251,590 | -1.49% |
| Presque Isle Downs and Casino | $283,619 | $489,992 | -42.12% |
| Statewide Total | $102,923,741 | $88,914,664 | 15.76% |
Sports Wagering Revenue
June 2022 total sports wagering handle was $393,494,222 or 6.35% below the June 2021 total of $420,193,377. At the same time, the taxable revenue figure for June 2022 was $12,769,552 compared to $34,225,520 in June 2021 a decrease of 62.69%.
June 2022 sports wagering total handle and revenue is as follows:
| Casino Operator | Total
Handle3 |
Retail
Revenue |
Online Revenue | Total Revenue |
| Valley Forge Casino Resort | $158,186,899 | $224,613 | $5,184,637 | $5,409,250 |
| Hollywood Casino at the Meadows | $88,596,441 | -$44,607 | $1,983,639 | $1,939,032 |
| Hollywood Casino at Penn National | $24,245,610 | -$140,942 | $1,282,928 | $1,141,986 |
| Parx Casino | $11,658,020 | $370,066 | $620,482 | $990,548 |
| Rivers Casino Pittsburgh | $19,062,393 | $89,094 | $860,059 | $949,153 |
| Rivers Casino Philadelphia | $12,608,598 | $226,300 | $471,526 | $697,826 |
| Hollywood Casino Morgantown | $44,914,292 | $10,032 | $391,341 | $401,373 |
| Mount Airy Casino Resort | $5,584,054 | -$9,732 | $332,707 | $322,975 |
| Live! Casino Philadelphia | $6,642,473 | $171,118 | $103,366 | $274,484 |
| Hollywood Casino York | $7,263,126 | $46,894 | $201,204 | $248,098 |
| South Philly Race & Sportsbook1 | $1,333,914 | $193,774 | $0 | $193,774 |
| Mohegan Sun Pocono | $4,646,108 | $78,231 | -$11,533 | $66,699 |
| Live! Casino Pittsburgh | $864,476 | $63,741 | $0 | $63,741 |
| Parx Malvern1 | $235,160 | $43,739 | $0 | $43,739 |
| Harrah’s Philadelphia | $2,514,082 | $2,384 | $40,867 | $43,252 |
| Mohegan Sun Lehigh Valley2 | $1,010,695 | $40,716 | $0 | $40,716 |
| Wind Creek Bethlehem | $1,441,493 | $26,837 | $8,549 | $35,386 |
| Presque Isle Downs and Casino | $2,686,387 | -$68,802 | -$23,677 | -$92,478 |
| Statewide Total | $393,494,222 | $1,323,457 | $11,446,095 | $12,769,552 |
1 Operated by Parx Casino
2 Operated by Mohegan Sun Pocono
3 A breakout of the handle between retail and online sportsbooks can be found on the website report.
Sports wagering revenue for each of the casinos for June 2022 and June 2021, if applicable, is as follows:
| Operator | June 2022 Sports Wagering Revenue | June 2021 Sports Wagering Revenue | % Change |
| Valley Forge Casino Resort | $5,409,250 | $16,838,572 | -67.88% |
| Hollywood Casino at the Meadows | $1,939,032 | $5,842,191 | -66.81% |
| Hollywood Casino at Penn National | $1,141,986 | $2,485,860 | -54.06% |
| Parx Casino | $990,548 | $1,790,523 | -44.68% |
| Rivers Casino Pittsburgh | $949,153 | $1,492,075 | -36.39% |
| Rivers Casino Philadelphia | $697,826 | $1,852,479 | -62.33% |
| Hollywood Casino Morgantown | $401,373 | $1,325,326 | -69.72% |
| Mount Airy Casino Resort | $322,975 | $698,500 | -53.76% |
| Live! Casino Philadelphia | $274,484 | $643,652 | -57.36% |
| Hollywood Casino York | $248,098 | n/a | n/a |
| South Philly Race & Sportsbook1 | $193,774 | $342,472 | -43.42% |
| Mohegan Sun Pocono | $66,699 | $283,355 | -76.46% |
| Live! Casino Pittsburgh | $63,741 | $137,580 | -53.67% |
| Parx Malvern1 | $43,739 | n/a | n/a |
| Harrah’s Philadelphia | $43,252 | $114,375 | -62.18% |
| Mohegan Sun Lehigh Valley2 | $40,716 | $145,945 | -72.10% |
| Wind Creek Bethlehem | $35,386 | $7,072 | 400.40% |
| Presque Isle Downs and Casino | -$92,478 | $225,542 | -141.00% |
| Statewide Total | $12,769,552 | $34,225,520 | -62.69% |
1Operated by Parx Casino
2 Operated by Mohegan Sun Pocono
Tax revenue generated from sports wagering during June 2022 was $4,597,039*.
Video Gaming Terminals
Total adjusted revenue for June 2022 for video gaming terminals (VGTs) was $3,506,902 or 6.15% higher than June 2021 when revenue was $3,303,745. By the close of June 2022, four VGT Terminal Operators were operating the maximum permitted five machines at 65 truck stop establishments.
Truck Stop VGT adjusted revenue for each of the terminal operators during June 2022 is as follows:
| VGTs Terminal Operator | June 2022 VGT Revenue | June 2021 VGT Revenue | % Change |
| Marquee by Penn1 | $2,059,050 | $2,333,068 | -11.74% |
| Commonwealth Gaming2 | $656,659 | $460,293 | 42.66% |
| J&J Ventures Gaming 3 | $451,728 | $193,340 | 133.64% |
| Jango4 | $339,465 | $317,044 | 7.07% |
| Statewide Total | $3,506,902 | $3,303,745 | 6.15% |
1 operated VGTs in 26 establishments during June
2 operated VGTs in 15 establishments during June
3 operates VGTs in 14 establishments during June
4 operates VGTs in 10 establishments during June
Tax revenue collected from the play of VGTs in June 2022 was $1,823,589*.
Fantasy Contests
Fantasy Contests revenue was $1,505,963 in June 2022, a decrease of 20.39% over June 2021, when revenue was $1,891,667.
Fantasy Contests adjusted revenue for each of the operators which had revenue for June 2022 and June 2021 are displayed in the following table:
| Fantasy Contests Operator | June 2022 Fantasy Revenue | June 2021 Fantasy Revenue | % Change |
| FanDuel | $843,682 | $884,656 | -4.63% |
| DraftKings | $641,409 | $994,389 | -35.50% |
| Underdog Sports, Inc. | $10,128 | $3,930 | 157.69% |
| Yahoo Fantasy Sports | $9,441 | $8,647 | 9.18% |
| Fantasy Sports Games LLC | $910 | n/a | n/a |
| Sportshub Technologies | $394 | $44 | 801.17% |
| Statewide Total | $1,505,963 | $1,891,667 | -20.39% |
Tax revenue collected from the play of Fantasy Contests in June 2022 was $225,894*.
*All tax revenue figures reflect amount generated prior to any adjustments by the PA Department of Revenue
About the Pennsylvania Gaming Control Board
The Pennsylvania Gaming Control Board is tasked to oversee all aspects of gambling involving 16 land-based casinos, online casino games, retail and online sports wagering, and Video Gaming Terminals (VGTs) at qualified truck stops, along with the regulation of online fantasy sports contests.
The land-based casino industry in Pennsylvania consists of six racetrack (Category 1) casinos, five stand-alone (Category 2) casinos, two resort (Category 3) casinos and three mini-casinos (Category 4). Casino expansion will continue over the next couple of years with the anticipated openings of up to two additional Category 4 casinos. A significant job generator in the Commonwealth, casinos and the other types of Board-regulated gaming is expected to generate over $2 billion in tax revenue during the 2021/2022 State Fiscal Year.
Additional information about both the PGCB’s gaming regulatory efforts and Pennsylvania’s gaming industry can be found at https://gamingcontrolboard.pa.gov. You can also follow the agency on Twitter by choosing @PAGamingControl.
William Hill US and Mescalero Apache Tribe Announce New Sports Book at Inn of the Mountain Gods Resort & Casino in New Mexico
LAS VEGAS (June 24, 2019) – William Hill US, ...
Sports betting is days away from becoming legal in Indiana
INDIANAPOLIS (AP) — Sports betting is days away fr...

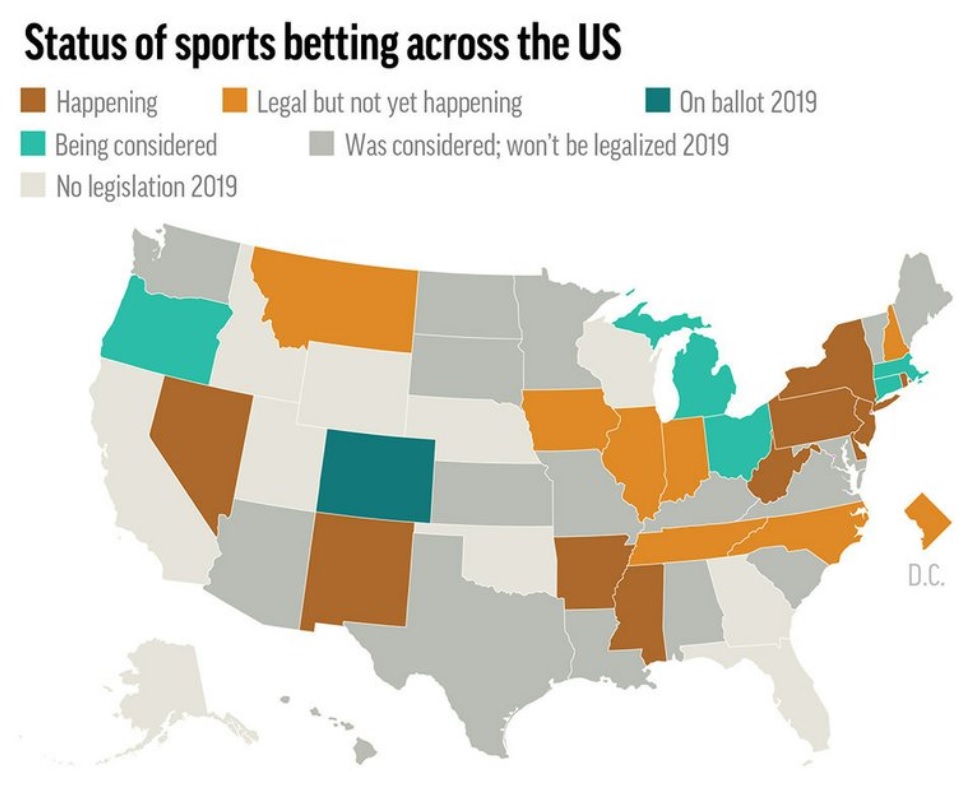
Half of US offers legal sports betting as NFL season begins
EAST RUTHERFORD, N.J. (AP) — More than half of the...
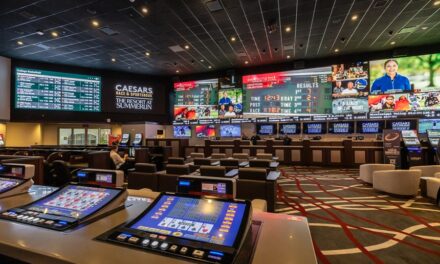
Caesars now operates sportsbooks in seven states at nearly 30 venues
29 Sports Betting Locations Across Seven States by...
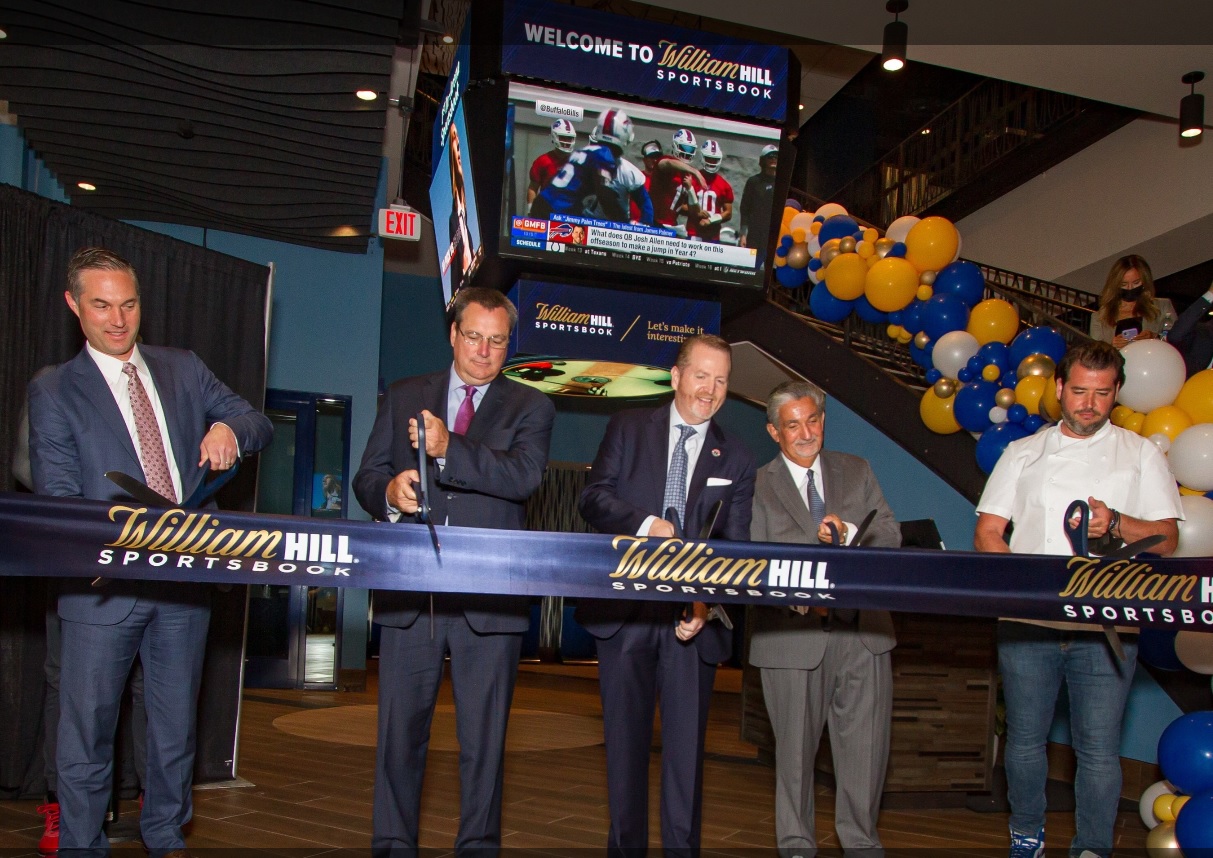
William Hill Sportsbook Officially Opens at Capital One Arena in Washington, D.C.
WASHINGTON, May 26, 2021 /PRNewswire/ -- Marking a...